Wildfires in Spain – Data Pipeline & Web Map
Wildfires are a growing environmental concern in Southern Europe. In this project, I explored open wildfire data for Spain, cleaned and transformed it with FME, and published an interactive Leaflet map. The goal was to demonstrate a lightweight geospatial data pipeline – from raw shapefiles to a live web map – that could be reused for other datasets as well.
This demo project shows how open geospatial data can be transformed into an interactive web map through a lightweight ETL pipeline. Starting from raw Copernicus wildfire polygons, I filtered, validated, and simplified the dataset in FME, then exported it as GeoJSON. Finally, I built and embedded a Leaflet map into WordPress, making the results accessible online.
The workflow highlights practical skills in spatial data cleaning, automation, and web publishing – a reusable approach that can be applied to many other geospatial datasets.
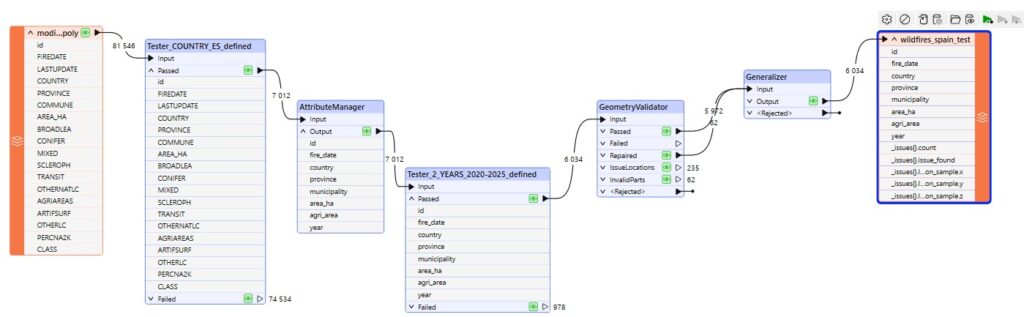
Workflow (step by step)
- Source data – Downloaded open wildfire polygons from Copernicus Emergency Management Service.
- Filtering – Used FME to limit the dataset:
- Tester 1: select only wildfires in Spain (COUNTRY = ES)
- Tester 2: select only years 2020–2025
- Attribute cleaning – AttributeManager to rename fields and keep only necessary columns.
- Validation – GeometryValidator to fix invalid geometries.
- Generalization – Simplified polygons to reduce file size for web use.
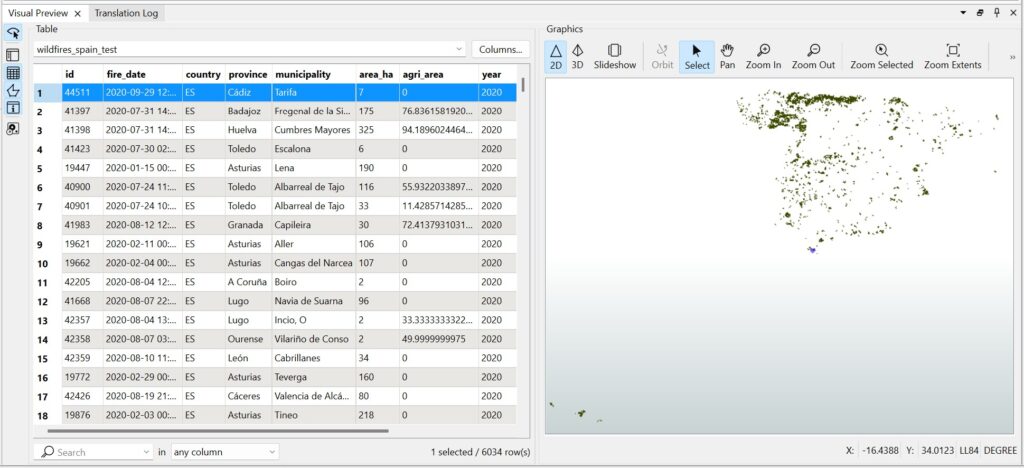
- Output – Exported as GeoJSON (EPSG:4326, 6 decimal precision).
- Web map – Built an interactive Leaflet map (with year-based colors and legend) and embedded it into WordPress.
The map uses a year-based color scheme (yellow = 2020, red = 2025) to highlight the temporal distribution of wildfires.
View the interactive map here fullscreen here.