Smart alarm – subscription analytics & churn optimization
Data-driven business performance analysis for a subscription-based security service, focusing on churn reduction and revenue optimization.
View the full project code on GitHub →
Overview
This project analyzes the performance of a fictional subscription-based security company.
The objective was to design a KPI framework and build a decision-ready dashboard connecting operational performance with revenue, payment success, and churn.
The solution combines Python-generated synthetic data, structured data modeling, and Power BI dashboard development.
Special focus was placed on metric accuracy, trend analysis, and percentage-based KPI logic.
The goal was to identify performance trends, detect churn risk, and translate operational and financial data into actionable business insights.
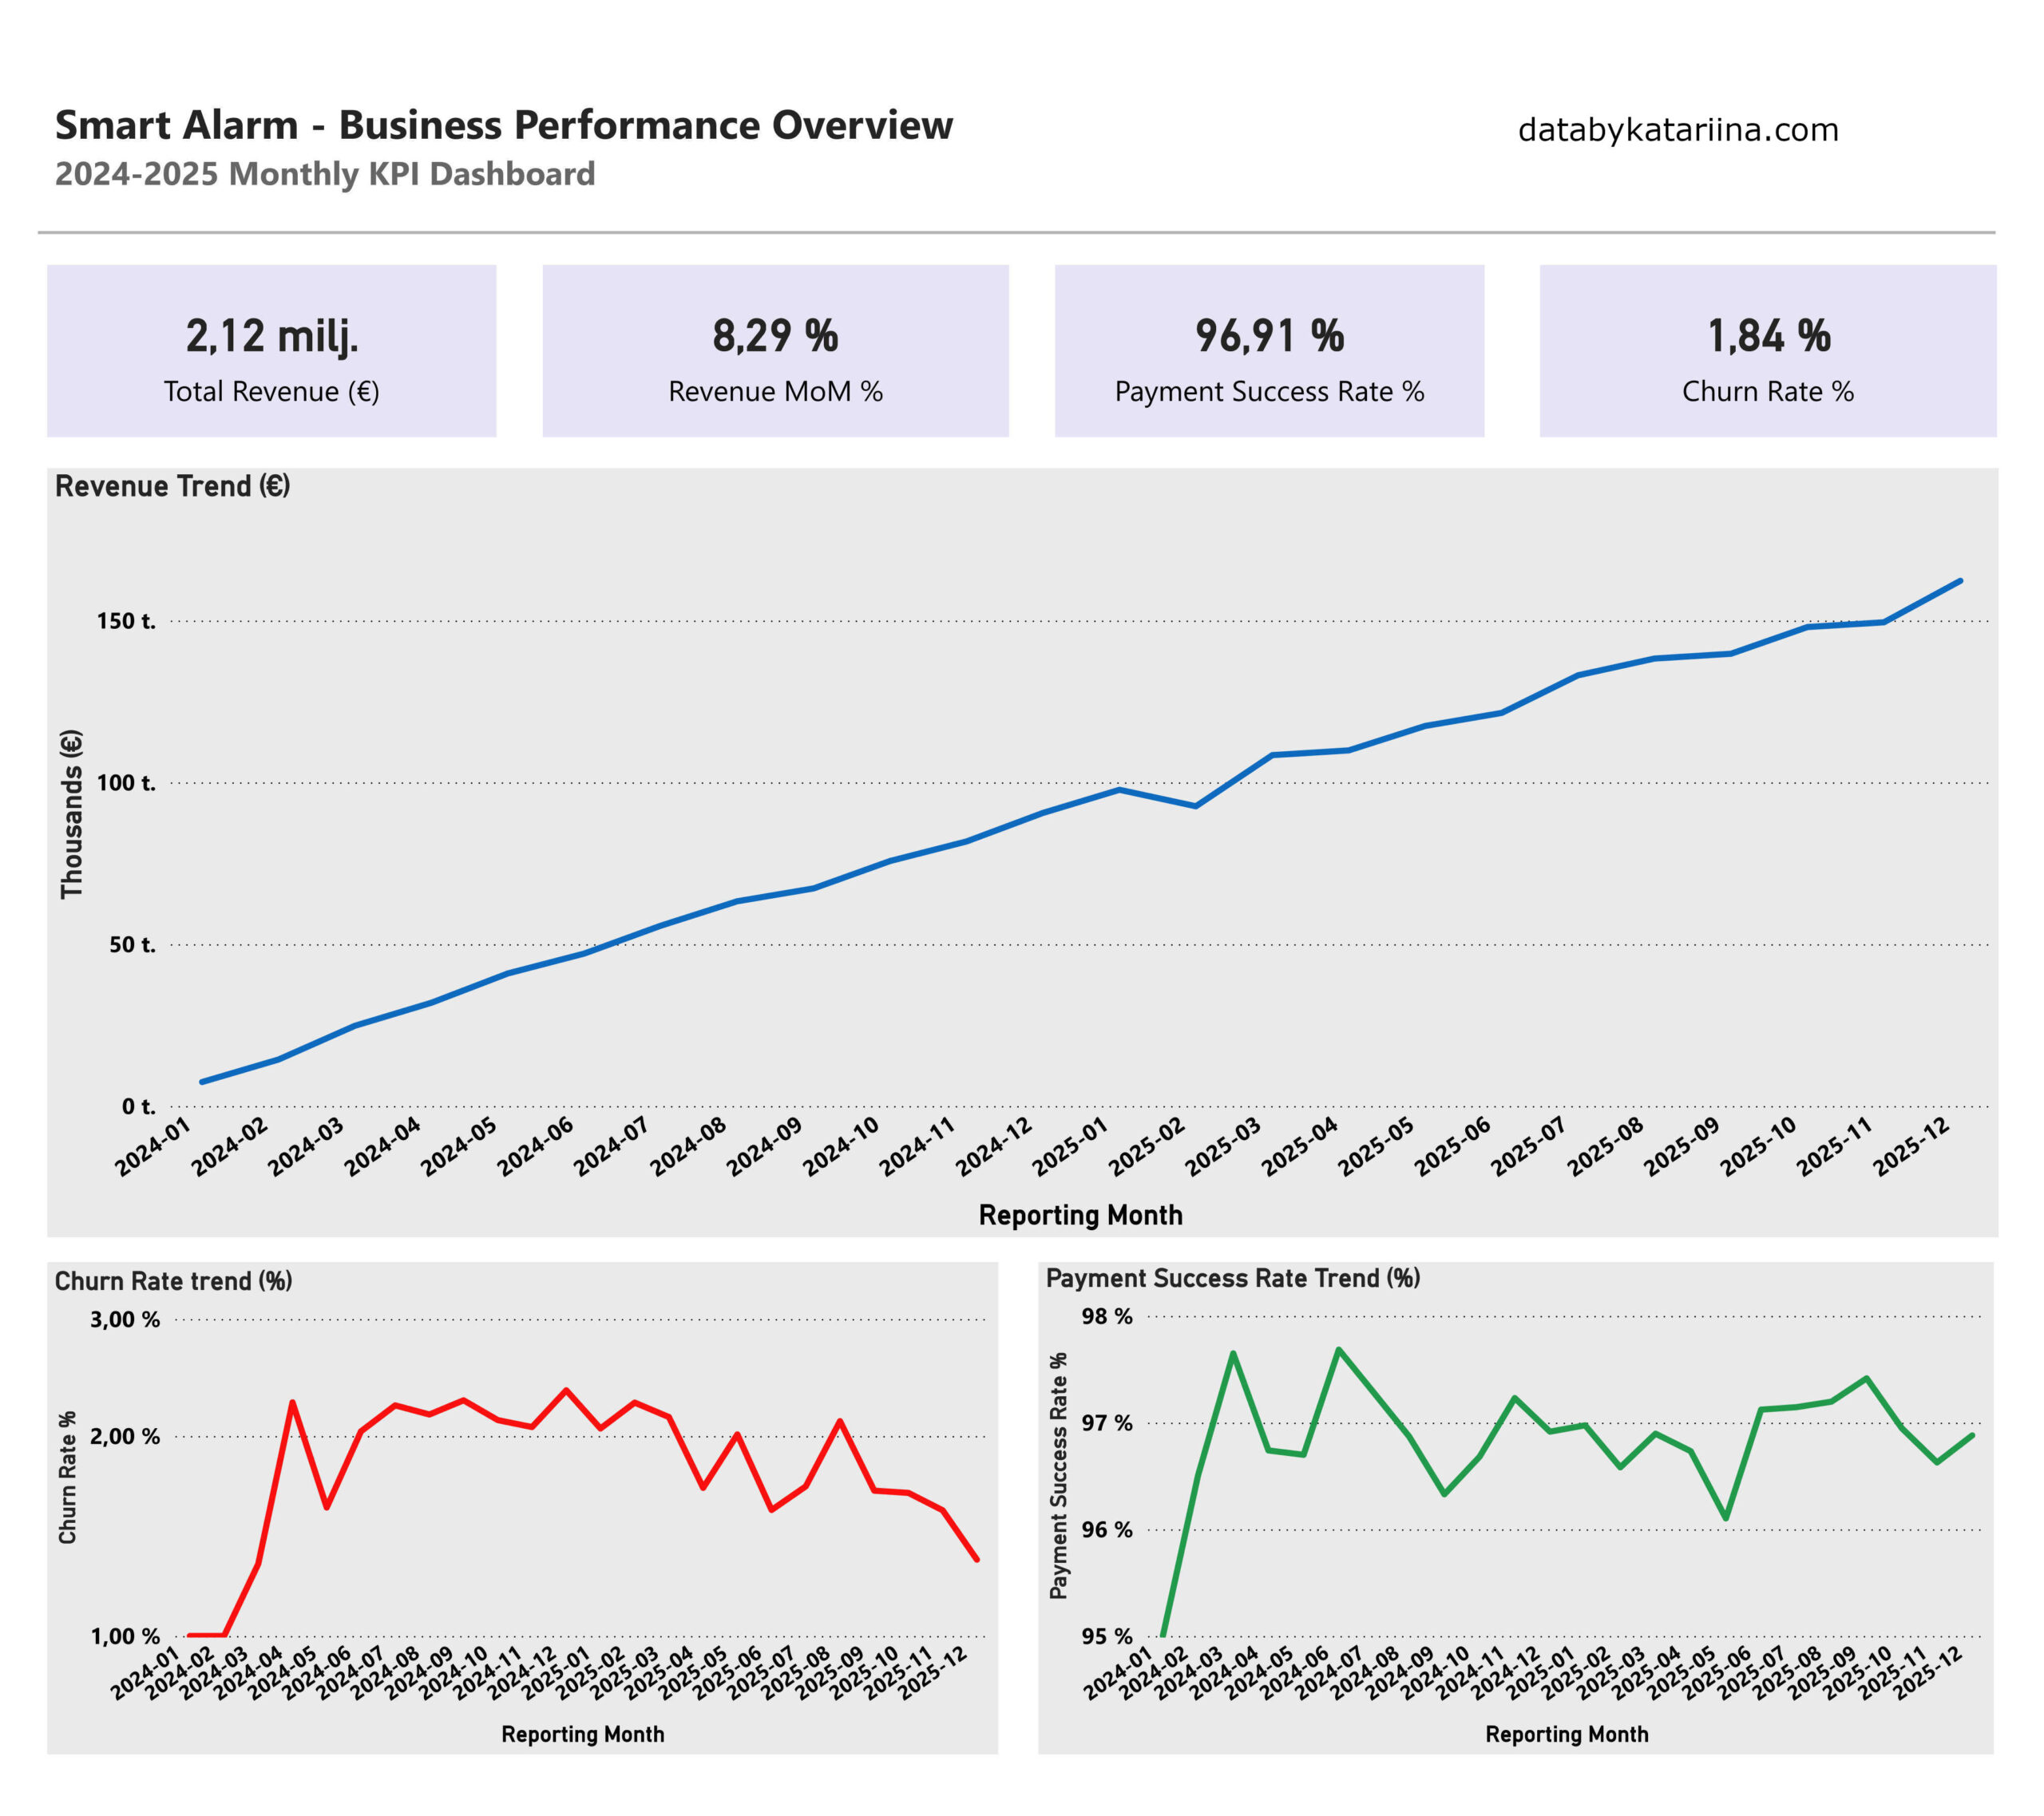
Executive KPI dashboard highlights revenue growth, churn trends, and payment success in a subscription-based business.
Business Context
In subscription- based businesses, sustainable growth depends on balancing revenue expansion with churn control and operational efficiency. Security service companies rely heavily on recurring monthly revenue. However, profitability is strong influenced by:
- Customer churn
- Installation lead times
- Support quality
- Upsell adoption
- Customer lifetime value
The objective of this project was to design a data-driven framework that connects operational performance with financial outcomes.
What this Demo Covers:
- Data pipeline & transformation (Python → SQL → Power BI
- Business problem identification
- KPI framework design (MRR, churn, CLV, SLA performance
- SQL-based data modeling
- Cohort & churn analysis logic
- Executive Power BI dashboard
- Actionable business recommendations
Strategic Angle
This project emphasizes:
- Enabling data-driven decision-making at executive level
- Translating business goals into measurable KPIs
- Identifying revenue leakage through churn analysis
- Linking operational delays to financial impact
- Supporting decision-making with structured analytics
Outcomes
Key Outcomes
- Designed a structured KPI framework for subscription performance
- Built an executive-level Power BI dashboard for decision-making
- Modeled revenue, payment success, and churn dynamics over time
- Delivered actionable insights for retention and performance optimization
Key insights
- Revenue shows consistent monthly growth across 2024–2025, reaching 2.12 M€ in total
- Payment success remains stable at around 97%, indicating strong transaction reliability
- Churn peaks in mid-2024 but stabilizes below 2% in 2025
- Overall performance suggests sustainable growth with controlled churn and stable operational efficiency
- Churn reduction emerges as the key driver for long-term revenue sustainability